MATH 1040 - Introduction to Statistics
Lesson 6.1 Measures of Center - Mean
Reading
Reading sections are from the Introductory Statistics Textbook
- 2.2.1 Measures of Center (pages 56-58)
- 2.2.4 Calculator: summarizing 1-variable statistics (pages 64-66)
Lesson
The mean (\(\bar{x}\)) is a balance between all the numbers in a dataset. By balance, we mean that the middle leans more toward the heavily concentrated values.
To calculate the mean: \(\bar{x} = \frac{\text{add all values together}}{\text{number of values}} = \frac{x_1+x_2+x_3+\dots}{n} = \frac{\sum x_i}{n}\)
Take the dataset { 15, 16, 16, 19 }. The mean is, \(\bar{x} = \frac{15+16+16+19}{4} = \frac{66}{4} = 16.5\)
But if there are more values on one end, then the mean will shift in that direction. If we add a value of 18, then there are more values on the upper side of the dataset and the mean will shift higher. The mean of { 15, 16, 16, 18, 19 } is, \(\bar{x} = \frac{15+16+16+18+19}{5} = \frac{84}{5} = 16.8\)
Problems with the mean
The mean is the primary measure of the center of the data. However, there is a major problem with it. Since it depends on the values of the dataset, an extra value will change it, and the more extreme the value is, the more it will change.
For example, if we take our original dataset and add a value of 38 instead of 18, then the mean is even higher. The mean of { 15, 16, 16, 19, 38 } is, \(\bar{x} = \frac{15+16+16+19+38}{5} = \frac{104}{5} = 20.8\)
So, the more extreme the value, the more the mean changes. This makes the mean very temperamental. So, we have a couple of other measures of center that we’ll examine in addition to the mean.
Two common means
There are two common means:
- The population mean (\(\mu\))
- The sample mean (\(\bar{x}\))
Both are calculated the same way.
Technology
It is important to know how the values we discuss are calculated. However, at this level of statistics, using the calculator will be useful. So, now that we are getting into the calculations portion of the class, we will be using the calculator frequently. So, I will start including instructions on using these calculators.
Since I recommended the TI-83/84 for this class, I will give instructions for these calculators. However, you are more likely to use software like Microsoft Excel or Desmos in the future. So, I will also provide instructions for using Excel, Desmos, and/or other useful software as needed.
Just click the tabs in this section to see the instructions for the technology you need to learn about.
TI-83/84
Instructions for calculating the mean on a TI-83 or TI-84:
- Click the
STATbutton - Under the
EDITmenu, select1:Edit...
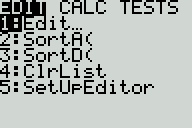
- Choose a list (Default is list
L1) - Enter each value by typing the first value, press
ENTER, type the second value, pressENTER, etc.
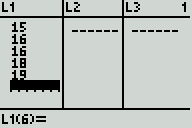
- Once the data is entered, again press the
STATbutton - Under the
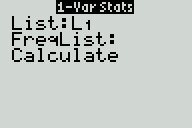
CALCmenu, select1:1-Var Stats
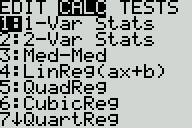
- Choose the list. For example, choose list 3 by typing
2nd3.- On the TI-84, you will be given a menu. Select the list, then push
until "Calculate" is highlighted
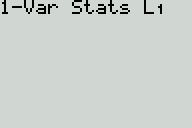
- On the TI-83, you will only be given the command on the home screen. Choose your list as stated, and the list will appear
- On the TI-84, you will be given a menu. Select the list, then push
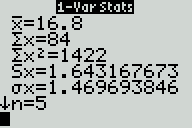
- The mean is the first number (\(\bar{x} = 16.8\))
Excel
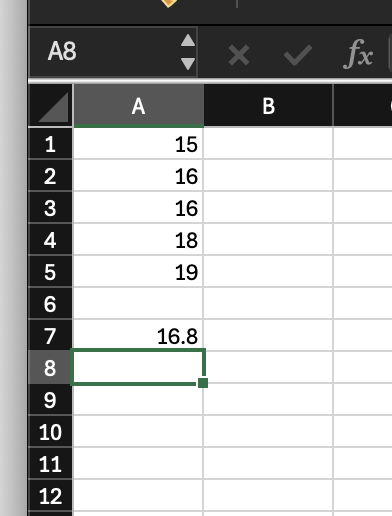
In Microsoft Excel,
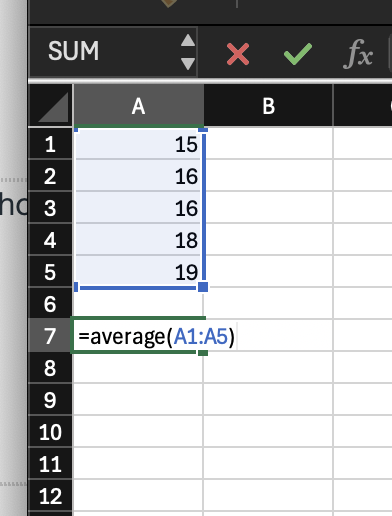
- Type all the values in a group of cells
- In another cell, type
=average( - Select the cells in one of these two ways:
- Using your mouse, click and drag from the first cell to the last
- Type in the cells (if your data are type in cells A1 through A9, then type “A1:A9”
- Close the parenthesis by typing
)and pressEnter
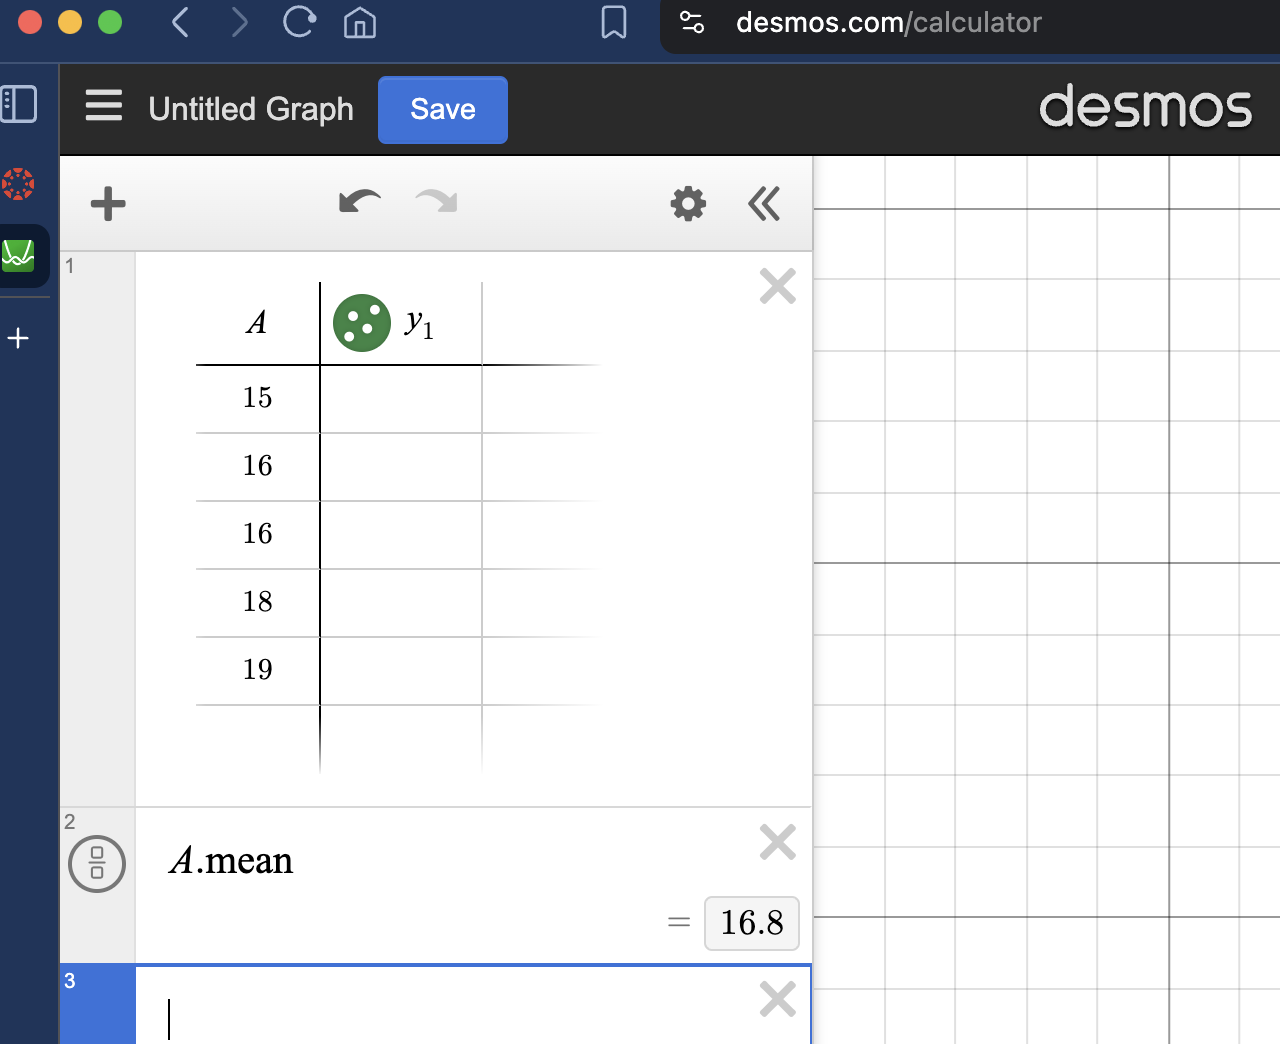
Desmos
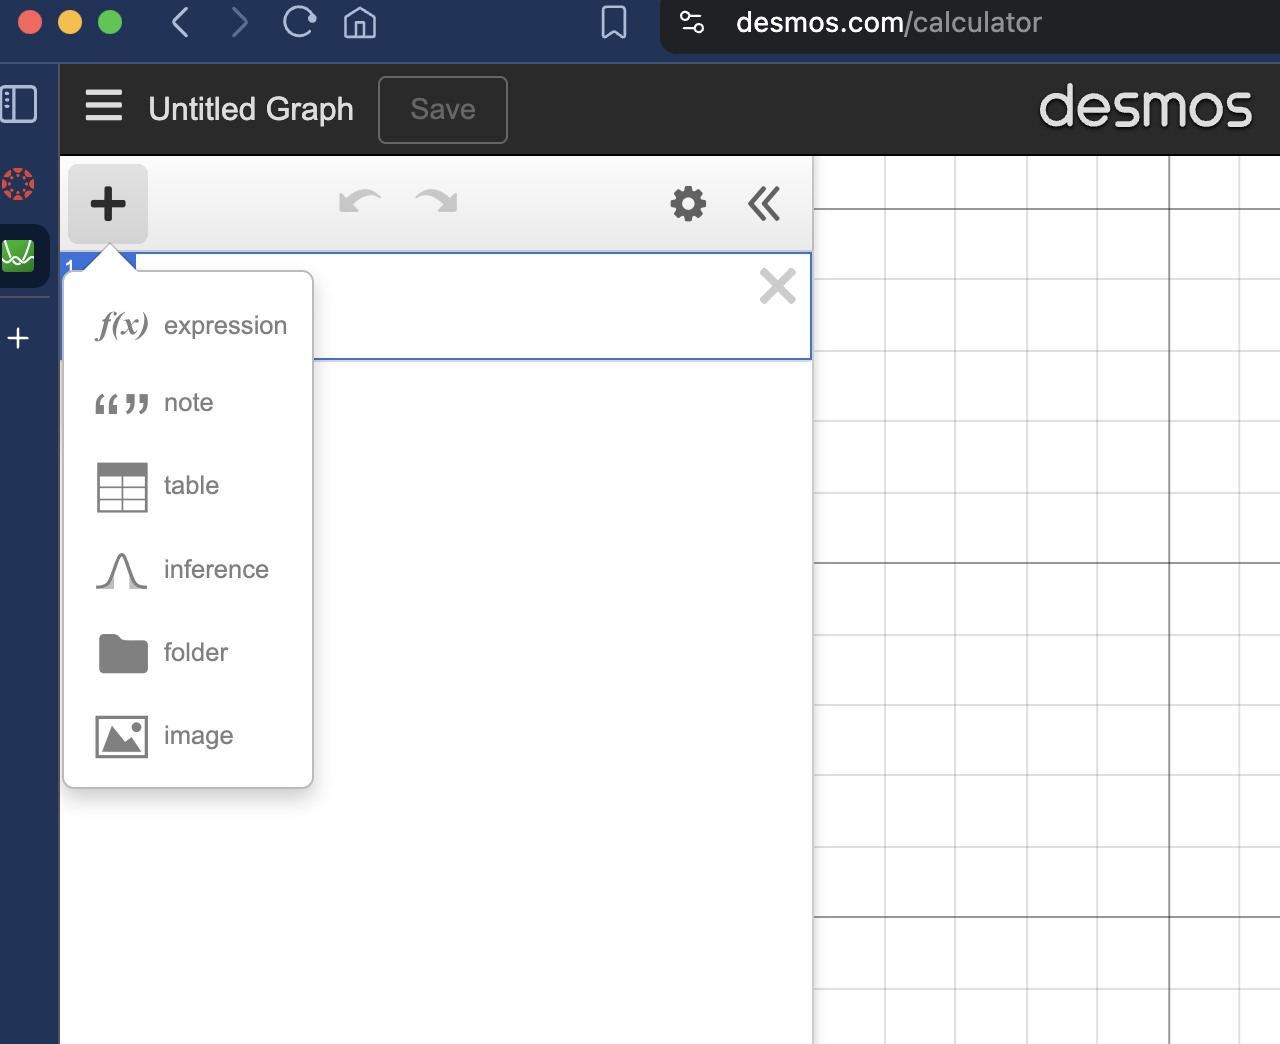
- Go to https://www.desmos.com/calculatorLinks to an external site.
- Click the large ( + ) in the top-left corner and select “table”
- Give a name to the column by clicking on “x1” and replacing it with a name (such a “A” as seen below)
- Enter the values of your dataset into the table
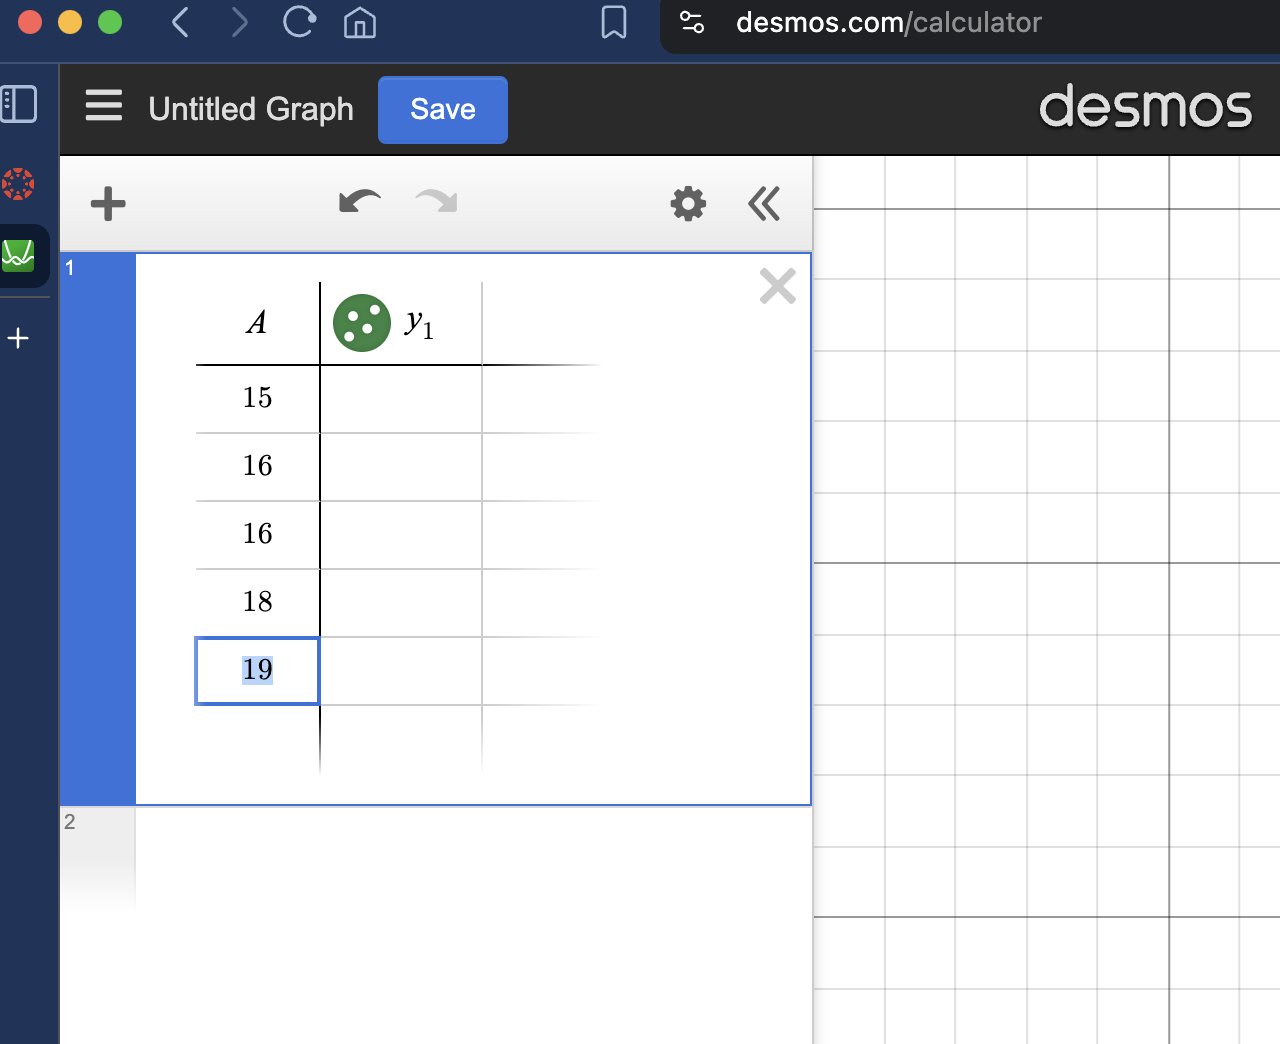
- Press the
arrow on your keyboard until the table is no longer selected and you have another box to type in - Type the name of your dataset followed by
.meanand press Enter