MATH 1040 - Introduction to Statistics
Lesson 15.3 Probability from a Normal Distribution
Reading
Reading sections are from the Introductory Statistics Textbook
- 4.1.3 Normal probability table (pages 143-144)
- 4.1.4 Normal probability examples (pages 144-147)
- 4.1.5 Calculator: finding normal probabilities (pages 148-150)
- 4.1.6 68-95-99.7 rule (page 150)
Lesson
A Z-Table is a convenient tool that helps us to calculate the area to the left of a z-score. Remember that area = probability, so by finding the area to the left of a z-score, we are finding the probability of randomly getting a value less than that z-score.
The Z-Table always gives us the area to the LEFT of the z-score. This area can also be found on a calculator. Unless it gives you the option to tell otherwise, it will also give you the area to the LEFT. (I have videos on finding the areas using a TI-84 below. I have also included a video on how to do this with Desmos below if desired.)
If the Z-Table only gives the area to the LEFT ($P(z < z_c)$), then how do you find the area to the RIGHT ($P(z > z_c)$)?
Recall that the total area under the normal curve is 1.0. So, $P(z < z_c) + P(z > z_c) = 1.0$. That means the two sides of the normal curve are complements of each other. In other words,
\[P(z > z_c) = 1.0 - P(z < z_c)\]In both of these examples, we have looked at how to find the areas of the tails. What if we want the area of a middle section? That is, what if we want $P(a < z < b)$? There are two methods:
Method 1: Remove the two tails
Remember that the entire area equals 1.0. If we remove the tail to the right of $b$ ($P(z > b)$, depicted in green in the figure below), and the tail to the left of $a$ ($P(z < a)$, depicted in blue in the figure below), then we’ll only be left with the area in the middle ($P(a < z < b), depicted in red in the figure below).
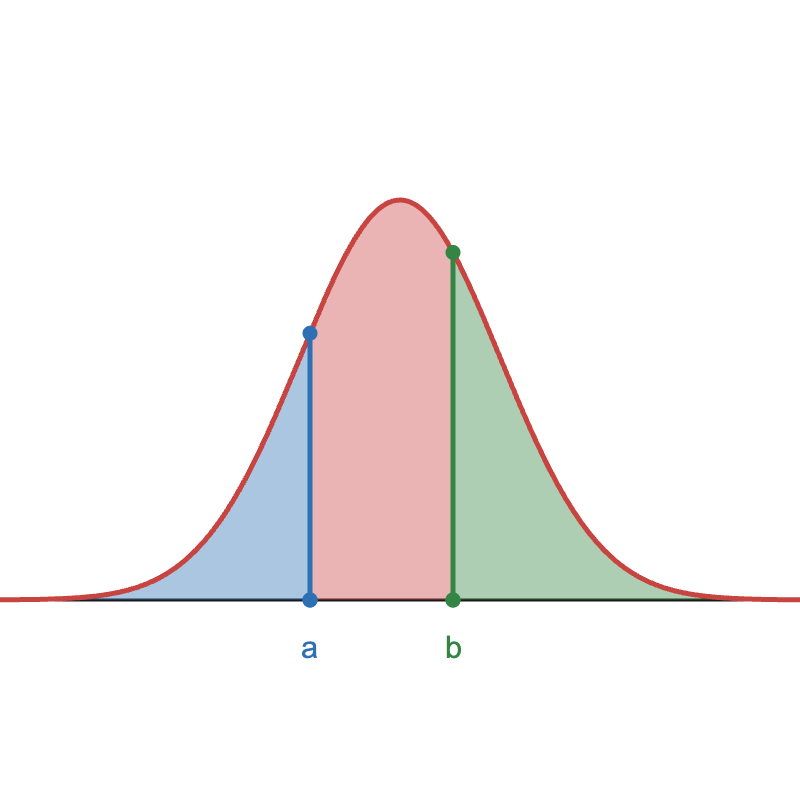
Method 2: Remove the left tail
We can start with the area left of $b$, which is $P(z < b)$. However, this also includes the left tail, which is $P(z < a)$ (depicted in blue in the figure below). We don’t want to include this area. So, we can just remove it. This will leave us just the area between $a$ and $b$, which is $P(a < z < b)$, depicted in red in the fibure below.
