MATH 1040 - Introduction to Statistics
Lesson 18.3 Confidence Interval when you know \(\sigma\)
Reading
Reading sections are from the Introductory Statistics Textbook
- 7.1.1 Using the z-distribution for inference when \(\mu\) is unknown and \(\sigma\) is known (pages 277)
Lesson
To find a confidence interval, these are the steps you need to follow:
- Verify the Central Limit Theorem applies (If it doesn’t apply, we can’t solve the problem)
- Find the Critical Values
- Find the Margin of Error
- Find the Confidence Interval
- Interpret the Confidence Interval
Let’s apply what we have learned in a specific scenario. This is the problem we will work on:
American mental abilities are often measured by an IQ test. The IQ distribution is normal with a mean of 100 and a population standard deviation of 15.
A random sample of 40 Snow College students is taken and they have an average IQ of 106.3. What is the true average IQ of Snow College students?
We’ll find a 90% confidence interval to find this true average. As we discussed, we need to do the following to find the confidence interval:
1. Verify the Central Limit Theorem
These are the two requirements needed to satisfy the Central Limit Theorem:
- The sample must be random
- The problem states that the sample is random, so this is satisfied
- The sample must be large enough
- Since we are dealing with quantitative data and means, we want the sample to be at least 30
- The sample size in the problem is \(n=40\). Since \(n\ge 30\), this is satisfied
Since both conditions are satisfied, the central limit theorem passes, and we can continue with this problem.
2. Find the Critical Values
We are given a confidence level of 90%.
- The remaining 10% is in the two tails, 5% in each tail
- The z-scores that separate the two tails are \(\pm\)1.645.
3. Find the Margin of Error
The equation for the margin of error is \(E = z_c\tfrac{\sigma}{\sqrt{n}}\).
- \(z_c = \pm 1.645\) is the critical value
- \(\sigma = 15\) is the population standard deviation
- \(n = 40\) is the sample size
Plugging these in, \(\begin{align*} E &= z_c\frac{\sigma}{\sqrt{n}} \\ &= \pm 1.645 \frac{15}{\sqrt{40}} \\ &= \frac{\pm 24.675}{6.3246} \\ &= \mathbf{3.90} \end{align*}\)
4. Find the Confidence Interval
The boundaries to our confidence interval are the sample mean (\(\bar{x}\)) plus or minus the margin of error (\(E\)).
- \(\bar{x} = 106.3\) is the sample mean
- \(E = 3.9\) is the standard error
The confidence interval is,
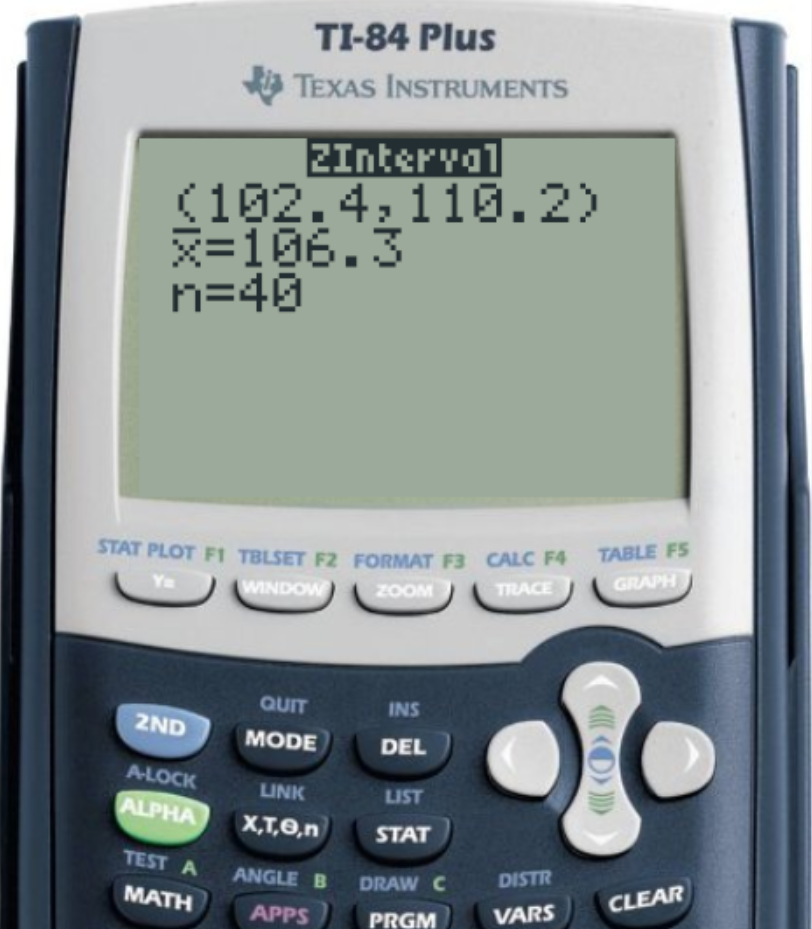
\[\mathbf{(102.4, 110.2)}\]5. Interpret the Confidence Interval
The goal was to find the true average IQ of Snow College students. Although we couldn’t find an exact value, we can find the confidence interval, which is a range of values the true average could be in. So, we take this goal and apply it to the confidence interval we just found.
Here is a proper interpretation of the confidence interval:
We are 90% confident that the true average of Snow College student IQ scores is between the values of 102.4 and 110.2.
What if you are given a confidence interval. Can you find the margin of error? (Would I be asking if you couldn’t?)
Practice
- A university is interested in estimating the average daily commute time for its students. A random sample of 50 students is selected, and their average commute time is found to be 32 minutes. The population standard deviation is known to be 8 minutes. Construct a 95% confidence interval for the true mean commute time of all students at the university.
- A manufacturer claims that its LED light bulbs have an average lifespan of 1,200 hours. A consumer protection agency wants to verify this claim. They randomly select 40 bulbs and find that the sample has an average lifespan of 1,165 hours. The population standard deviation is known to be 100 hours. Construct a 99% confidence interval for the true mean lifespan of the manufacturer’s LED light bulbs.
- A national education researcher wants to estimate the average SAT Math score for high school seniors in a particular state. A random sample of 60 students yields a sample mean score of 540. The population standard deviation is known to be 100 points. Construct a 92% confidence interval for the true mean SAT Math score of all high school seniors in the state.
Technology
TI-83/84
To calculate the Confidence Interval on a TI-83/84,
- Press
STAT - Select the
TESTSmenu - Select
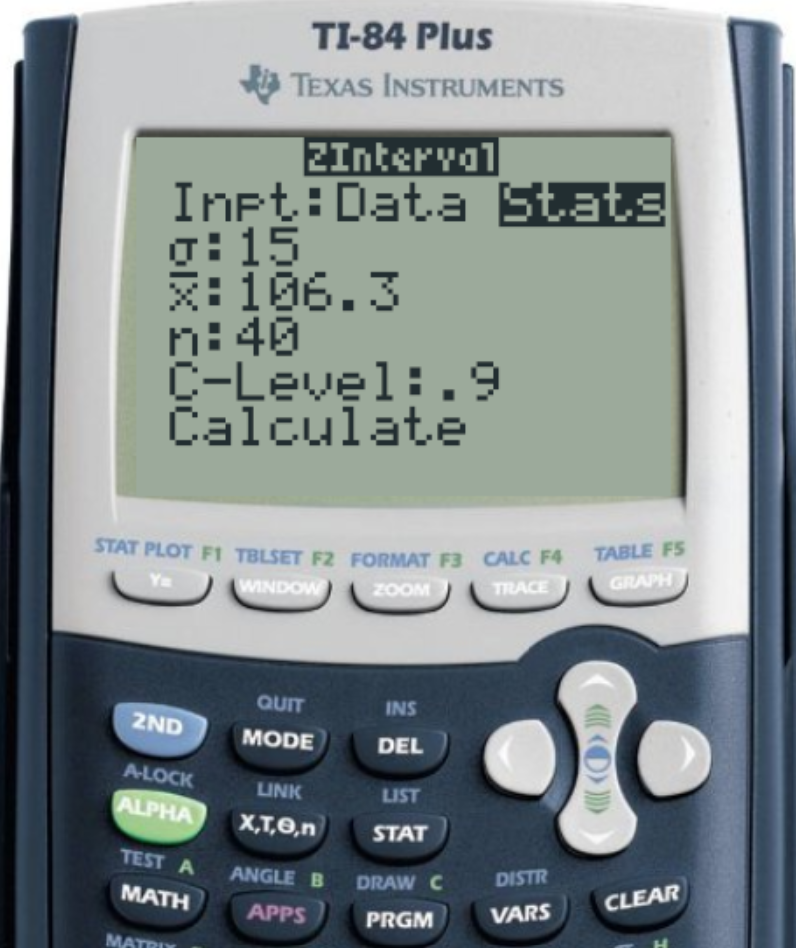
7:ZInterval... - Under “Inpt”, select “Stats”
- Enter \(\sigma\), \(\bar{x}\), \(n\), and the Confidence Level
- Select “Calculate”
Alternatively, you can put your data into a List, then under “Inpt” select “Data”. Indicate the list your data is in, and it will calculate \(\bar{x}\) and \(n\) for you. (You will still need to indicate \(\sigma\) and the confidence level.)