MATH 1040 - Introduction to Statistics
Lesson 20.2 How Confidence Intervals fit in
Reading
Lesson
Recall how the confidence interval is used to find the range of true values. We showed this with this example:
American mental abilities are often measured by an IQ test. The IQ distribution is normal with a mean of 100 and a population standard deviation of 15. A random sample of 40 Snow College students is taken and they have an average IQ of 106.3. Can we say with a 5% level of significance that the true average IQ of Snow College students is higher than the nation?
We found, with 90% confidence, that the true average IQ of Snow College students is between 102.4 and 110.2. This confidence interval is shown in the image below.
Now, let’s look again at this as a hypothesis test. We want to see if the true average IQ of Snow College students is larger than the national average. The nation has an average of 100, so that is our null value.
\[H_0: \mu = 100 \qquad\qquad H_A: \mu > 100\]In this image, we can see the confidence interval along with the null value
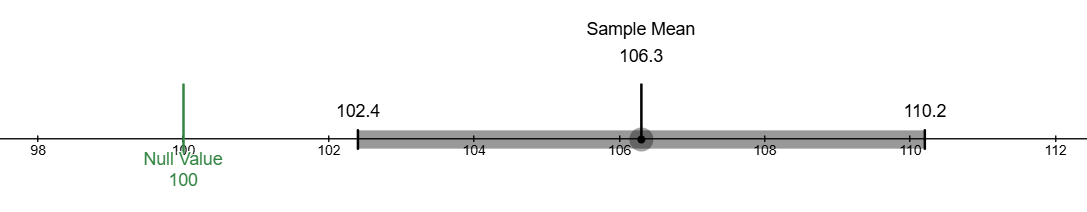
If the true value is most likely between 102.4 and 110.2, then there is not much chance that the true value can be equal to the null value (100). Because the confidence interval is completely above the null value, we can be pretty confident that the average IQ of Snow College students is higher than the national average.
So, in this case, we can reject the null hypothesis as we have enough evidence to suggest the true average is higher than the null value. Instead, we adopt the alternate hypothesis which claims Snow College students have a higher IQ.
Consider another school:
A random sample of 50 students from Medford College shows an average IQ of 98.3. Can we say with a 5% level of significance that the true average IQ of Snow College students is higher than the nation?
Doing a 90% confidence interval in this situation, we show that the true average is between 94.8 and 101.8.
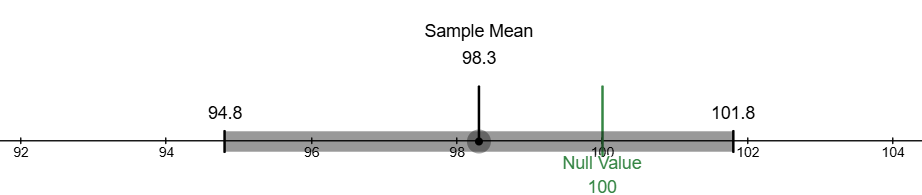
In this case, the null value of 100 is inside of the confidence interval. That means that there is a chance that the true IQ of students at Medford College is at or near 100. So, we fail to reject the null hypothesis since we don’t have enough evidence to reject it.
When doing hypothesis testing, we don’t actually look at confidence intervals. However, the method of hypothesis testing is actually closely related to confidence intervals. So, when I go through the hypothesis testing process in the next pages, I will include the confidence interval so that you can see that this works.
Practice
For each of the following questions, find the confidence interval and compare it to the null value. (Note that I give you the confidence level. We’ll discuss the significance level in the next page.)
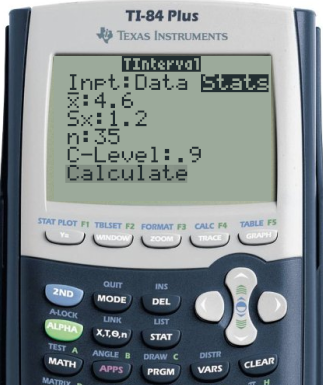
- A coffee shop claims that the average wait time for a customer to receive their order is no more than 4 minutes. A customer advocacy group believes the wait time is longer. A random sample of 35 customers had an average wait time of 4.6 minutes with a standard deviation of 1.2 minutes. At the 5% significance level (90% confidence level), test the claim that the average wait time is greater than 4 minutes.
- After solving on your own, check the
- After solving on your own, check the
- A smartphone manufacturer advertises that their new model has an average battery life of 20 hours. A tech reviewer suspects the battery life is less than advertised. A sample of 55 phones showed an average battery life of 18.7 hours with a standard deviation of 2.5 hours. Conduct a hypothesis test at the 1% significance level (98% confidence level).
- After solving on your own, check the
- After solving on your own, check the
- An educator wants to test whether a new teaching method affects student performance. Historically, the average score on a standardized exam is 75. The educator believes the new method may lead to a different average score. A class of 40 students taught with the new method had an average score of 78.2 with a standard deviation of 6.3. Test the hypothesis at the 5% significance level (95% confidence level).
- After solving on your own, check the
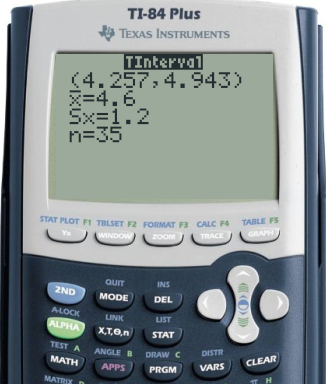 With 90% confidence, we see the true average wait time for customers is between 4.257 and 4.943 minutes. The null value ($$\mu_0 = 4$$) is *not* inside the confidence interval. So, we can __reject the null hypothesis__.
Therefore, there is enough evidence to suggest that the average wait time for customers to receive their orders is more than 4 minutes.
With 90% confidence, we see the true average wait time for customers is between 4.257 and 4.943 minutes. The null value ($$\mu_0 = 4$$) is *not* inside the confidence interval. So, we can __reject the null hypothesis__.
Therefore, there is enough evidence to suggest that the average wait time for customers to receive their orders is more than 4 minutes.

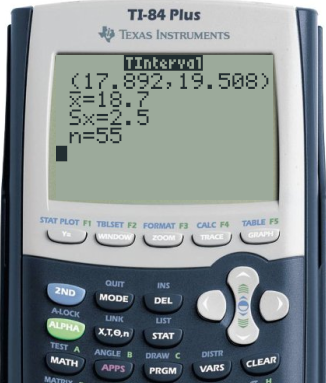 With 98% confidence, we see the true average wait time for customers is between 17.892 and 19.508 minutes. The null value ($$\mu_0 = 20$$) is *not* inside the confidence interval. So, we can __reject the null hypothesis__.
Therefore, there is enough evidence to suggest that the average battery life is less than 20 hours.
With 98% confidence, we see the true average wait time for customers is between 17.892 and 19.508 minutes. The null value ($$\mu_0 = 20$$) is *not* inside the confidence interval. So, we can __reject the null hypothesis__.
Therefore, there is enough evidence to suggest that the average battery life is less than 20 hours.
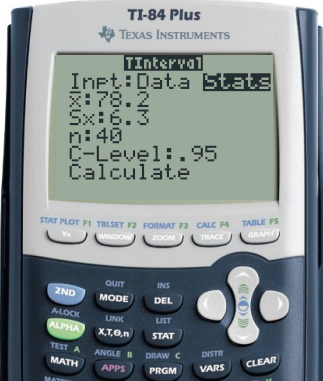
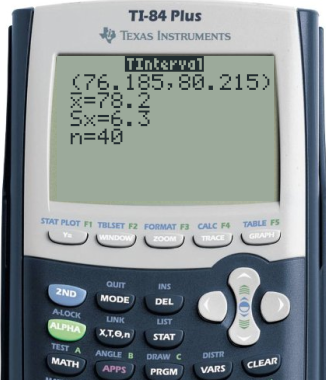 With 98% confidence, we see the true average score is between 76.185 and 80.215 minutes. The null value ($$\mu_0 = 75$$) is *not* inside the confidence interval. So, we can __reject the null hypothesis__.
Therefore, there is enough evidence to suggest that the average score with the new teaching method is different from the average score with the old teaching method.
With 98% confidence, we see the true average score is between 76.185 and 80.215 minutes. The null value ($$\mu_0 = 75$$) is *not* inside the confidence interval. So, we can __reject the null hypothesis__.
Therefore, there is enough evidence to suggest that the average score with the new teaching method is different from the average score with the old teaching method.